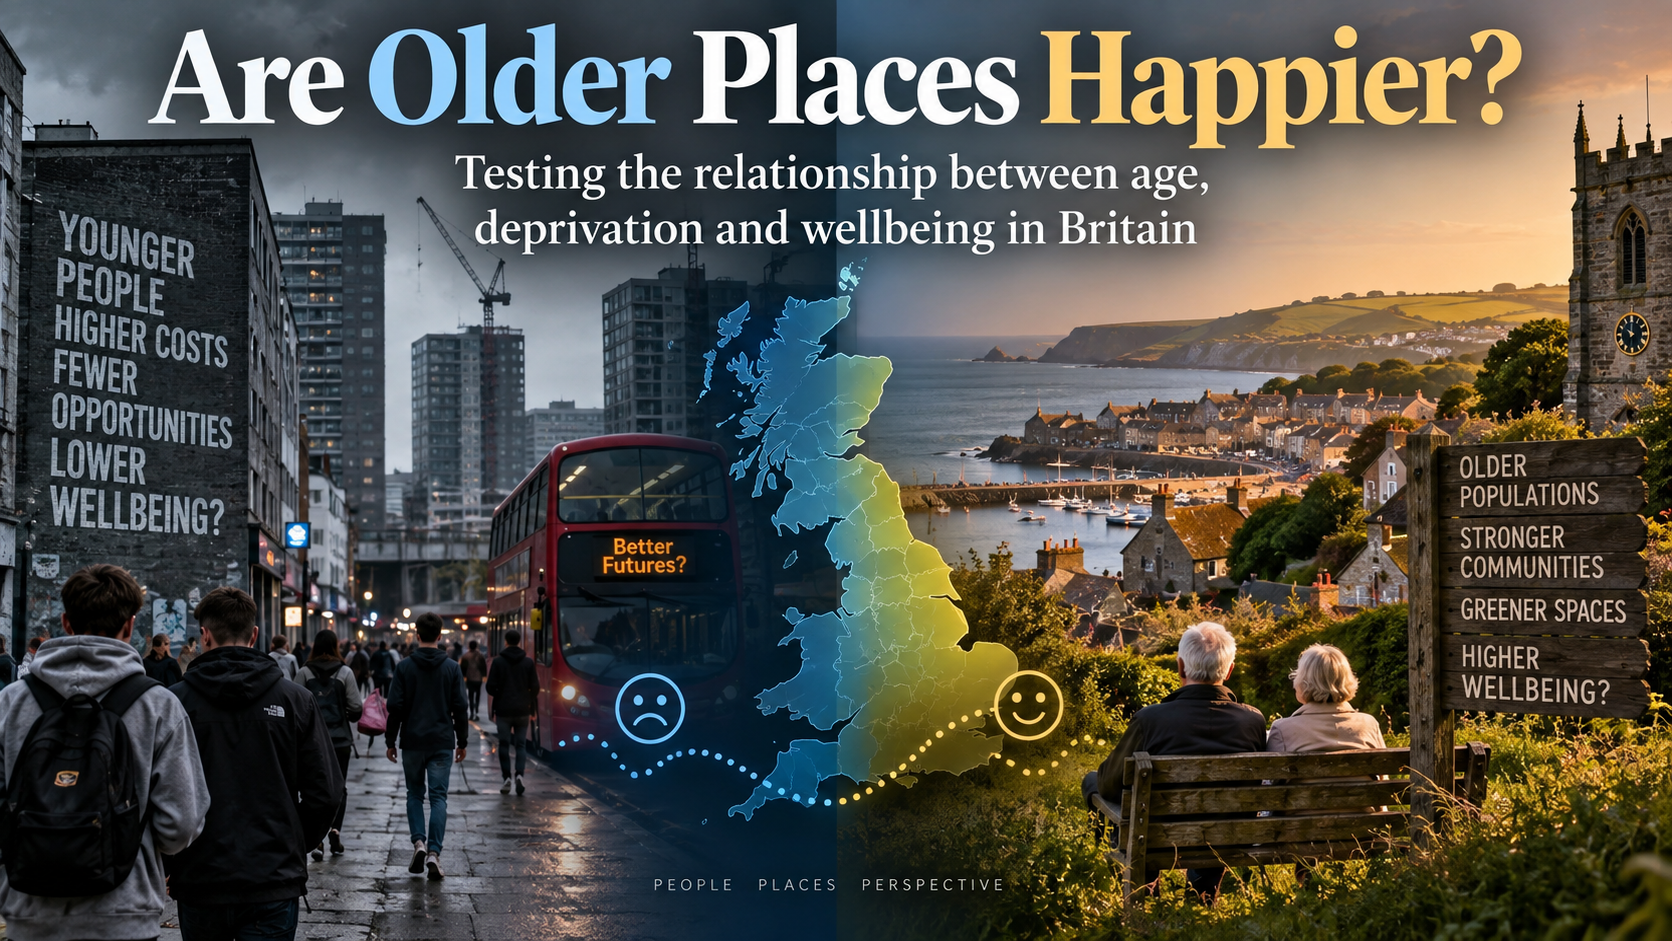
Testing the relationship between age, deprivation and well-being in Britain
Walk through different parts of Britain and an apparent pattern can be difficult to ignore.
Many places with conspicuously young populations are dense urban areas: expensive housing, heavy traffic, smaller living spaces, greater population turnover and, in some cases, substantial deprivation. Meanwhile, many older communities are found in smaller towns, rural districts and coastal areas that can appear quieter, greener and more settled.
It raises an intriguing question:
Do places with older populations actually tend to be happier?
And, if they do, is age itself responsible — or are age and happiness both consequences of something else?
The available evidence suggests that the observation deserves to be taken seriously. But it also shows why a simple conclusion such as “older places are happier because older people are happier” would be misleading.
The first clue: Britain’s age geography is extraordinary
The age profile of the UK varies dramatically from place to place.
According to the 2021 Census, the median age across England and Wales was 40. London was considerably younger, at 35, while the South West had a median age of 44.
The differences become much larger at local-authority level. Tower Hamlets had a median age of just 30. Nottingham, Cambridge, Oxford and Manchester were all around 31.
At the other end of the spectrum, North Norfolk’s median resident was 54, Rother’s 53 and East Lindsey’s 52.
Universities explain part of this pattern, but not all of it. Britain’s major cities attract young adults for education and employment, while many rural and coastal areas contain much larger retired populations.
The country therefore provides a natural setting in which to ask whether the age of a place is associated with the wellbeing of the people living there.
There is evidence for the pattern
An Office for National Statistics analysis of English local authorities provides particularly interesting evidence.
ONS grouped local authorities according to four measures of personal wellbeing: life satisfaction, happiness, anxiety and whether people felt the things they did in life were worthwhile.
One cluster contained 74 local authorities that were below the median on all four wellbeing measures.
Of those authorities:
- 88% were urban;
- 62% had a median age of 40 or younger; and
- 34% were among the more deprived local authorities.
London was heavily represented: 56% of London’s local authorities fell into this cluster.
A second cluster, which performed below the median for happiness, life satisfaction and worthwhile feelings, was again disproportionately young and deprived.
So the geographical pattern is not simply anecdotal. Official statistics have detected an association between poorer wellbeing, younger local populations, urbanity and deprivation.
But that last sentence contains the central problem.
All four characteristics occur together.
Correlation is not explanation
Imagine plotting every local authority on a graph.
On one axis is its median age. On the other is its average happiness score.
If older authorities tend to appear higher on the happiness scale, we have discovered a correlation.
We have not demonstrated that the age of the population caused the difference.
A younger area may simultaneously have:
higher housing costs, more renters, greater population density, more unemployment or economic insecurity, more students, lower home ownership, greater population turnover, different household structures, different health outcomes and greater deprivation.
An older area may simultaneously have:
more homeowners, more retirees, lower population density, greater residential stability, more green space and a completely different socioeconomic composition.
Age could therefore be acting partly as a marker for the type of place being observed.
This distinction is crucial.
The proposition we really need to test is not:
“Are older places happier?”
It is:
“After accounting for deprivation, urbanisation, employment, health and other relevant characteristics, is the age structure of a place still associated with its reported wellbeing?”
That is a much harder and much more interesting question.
The individual-level evidence complicates the story
There is another reason not to interpret the geographical relationship too quickly.
At the individual level, happiness does not simply increase with age.
ONS research using more than 300,000 UK adults found a broadly curved relationship.
Happiness and life satisfaction were relatively high among younger adults, declined through adulthood, reached their lowest levels during middle age, and subsequently increased substantially.
People aged approximately 65–79 reported some of the highest levels of personal wellbeing.
At still older ages, wellbeing began to decline again.
In other words, the relationship resembles a distorted U or S-shaped curve rather than a straight line from unhappy youth to happy old age.
This matters enormously.
If young people themselves are not uniformly unhappy, yet younger places sometimes record poorer wellbeing, something about the characteristics of those places may be contributing to the association.
Deprivation is the obvious suspect
The strongest competing explanation is socioeconomic deprivation.
Deprivation can affect many of the things that plausibly influence everyday wellbeing: housing, employment, crime, health, environmental quality and financial security.
England’s official Index of Multiple Deprivation combines seven domains:
income; employment; education, skills and training; health and disability; crime; barriers to housing and services; and the living environment.
The 2025 English Indices of Deprivation show that deprivation remains heavily geographically concentrated, although deprived neighbourhoods exist across much of the country.
Middlesbrough, Birmingham, Hartlepool, Kingston upon Hull and Manchester were among the local-authority districts containing the highest proportions of neighbourhoods in England’s most deprived group.
Some of those places also have comparatively young populations.
That creates a classic confounding problem.
Suppose younger local authorities have lower average happiness.
Suppose younger local authorities are also more deprived.
And suppose deprivation independently reduces wellbeing.
The apparent relationship between age and happiness could therefore actually be substantially a relationship between deprivation and happiness.
Health introduces another complication
Health strongly influences subjective wellbeing, and health itself varies dramatically with both age and deprivation.
ONS Census analysis found substantially better self-reported health in England’s least deprived areas than its most deprived areas.
Importantly, this difference exists even among young people.
Among 15–19-year-olds, 64.2% of those living in the most deprived areas reported very good health, compared with 75.9% in the least deprived areas.
The deprivation gap became considerably larger through middle age.
This makes it dangerous to treat population age as an isolated explanatory variable.
Age, health, wealth, employment and geography interact.
There’s also an ecological fallacy waiting for us
Perhaps the most important statistical trap is assuming that characteristics of an area necessarily describe the individuals living within it.
Imagine that a seaside authority has:
median age: 52
average happiness: 7.8
while a city authority has:
median age: 31
average happiness: 7.2
It would be tempting to conclude that the older residents are responsible for the higher score.
But those figures alone cannot tell us that.
It is entirely possible that the 30-year-olds living in the older authority are happier than the 30-year-olds living in the younger authority.
If that happened, the important variable might not be how old you are.
It might be where and under what conditions you live.
This is known as the ecological fallacy: relationships observed between populations cannot automatically be assumed to describe relationships between individuals.
A particularly useful piece of ONS evidence
ONS has already performed an analysis that demonstrates why age adjustment matters.
It has published both age-standardised and non-age-standardised local-authority wellbeing estimates.
Age standardisation asks, approximately:
What would the comparison between these places look like if their different population age structures were accounted for?
That provides one way of separating the demographic composition of an area from its underlying wellbeing.
ONS has also examined correlations between local wellbeing and deprivation.
These datasets provide the ingredients for a much stronger test than simply comparing a few young cities with a few retirement areas.
How the hypothesis should actually be tested
A serious analysis should begin with every comparable local authority rather than selecting conspicuous examples.
For each authority we would collect:
Median age
from ONS population estimates.
Happiness and life satisfaction
from the ONS Annual Population Survey personal-wellbeing data.
Deprivation
from the relevant national deprivation indices.
Ideally, additional variables would include population density, urban/rural classification, employment, health, housing affordability, home ownership and student population.
The first calculation is straightforward:
median age ↔ happiness
and separately:
median age ↔ life satisfaction.
That establishes the raw geographical correlation.
The second stage is much more important.
We then estimate the relationship after accounting for deprivation and the other characteristics.
Conceptually:
Wellbeing = age structure + deprivation + urbanity + health + employment + housing + other factors
If the association with median age remains substantial after those controls, the proposition that there is something independently important about the age structure of communities becomes considerably more interesting.
If it largely disappears, a different conclusion follows:
young population was functioning as a proxy for other characteristics of disadvantaged urban areas.
Either result would be informative.
Reasons the apparent relationship might survive
There are plausible mechanisms through which population age structure itself could matter.
Older populations may have greater residential stability. People may have lived near neighbours for longer, producing stronger community networks.
Areas dominated by families and older residents may also develop different public spaces, businesses and services from places dominated by transient young adults.
Retirement removes commuting and employment pressures for some people. Older homeowners may have lower housing costs after paying down mortgages.
There may also be selection effects: people with sufficient resources can choose to retire to attractive rural or coastal areas.
In that case, however, the pleasant environment may partly explain the happiness rather than age itself.
Reasons the hypothesis might fail
There are equally powerful counterexamples.
University cities are exceptionally young because thousands of generally healthy young adults arrive every year. Their low median age tells us very little about deprivation.
Cambridge and Oxford illustrate the problem particularly well: both had median ages around 31 in the 2021 Census.
Conversely, an ageing population can sometimes result from younger residents leaving an area because employment opportunities are limited.
Some older coastal communities also experience serious deprivation, poor health and social isolation.
And among the oldest individuals, average wellbeing eventually declines.
So neither youth nor age is intrinsically a reliable measure of whether somewhere is flourishing.
What can reasonably be concluded?
There is credible evidence for the observation that prompted this investigation:
some of Britain’s younger urban local authorities also exhibit poorer wellbeing and greater deprivation, while a number of older, less urban authorities perform better on wellbeing measures.
ONS’s own clustering analysis detected essentially this combination of characteristics.
But the evidence does not justify the stronger statement:
“Places are happier because their populations are older.”
The demographic variable is entangled with deprivation, urbanisation, health, housing, employment and migration.
Indeed, that may be the more interesting discovery.
The question may not ultimately be why older people make places happier.
It may be why Britain has produced a geography in which youth, urbanisation, housing pressure and deprivation so often overlap, while some older populations are concentrated in quieter and more economically secure environments.
Age may be part of the story.
Or it may be the clue that leads us to the real one.
The next test
The hypothesis can now be made falsifiable.
Take every UK local authority for which comparable data are available.
Plot median age against happiness and life satisfaction.
Measure the correlation.
Then progressively control for deprivation, health, employment, housing and urbanisation.
If age continues to predict wellbeing after those adjustments, we have evidence of an independent relationship worth explaining.
If it does not, then the original observation was still useful — but what it revealed was not an age effect.
It revealed the socioeconomic geography hiding underneath it.
Leave a Reply